
User Guide
Using Finder Dashboard
Overview
The Finder dashboard displays analysis of all requests and reports.
To access the dashboard:
-
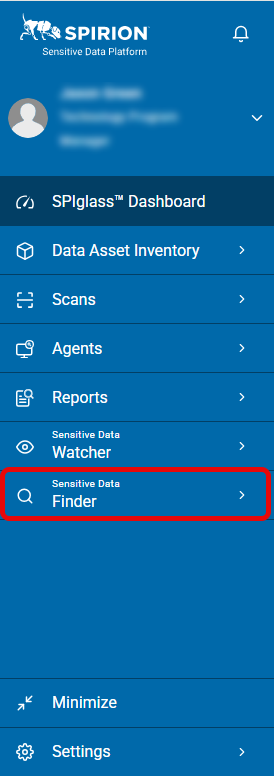
From the left menu, click Sensitive Data Finder.
-
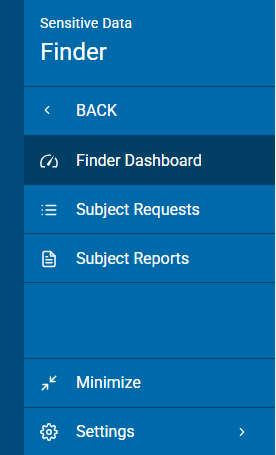
Click Finder Dashboard.
Dashboard Widgets
Dashboard widgets display your data:
-
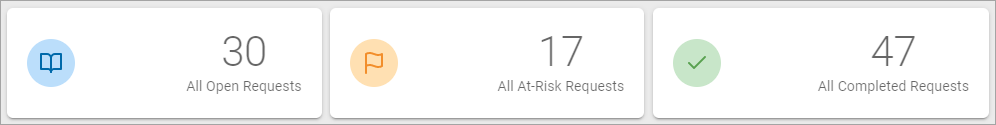
Totals:
Displays totals of the following:
-
All Open Request
-
All At-Risk Request
-
All Completed Requests
-
-
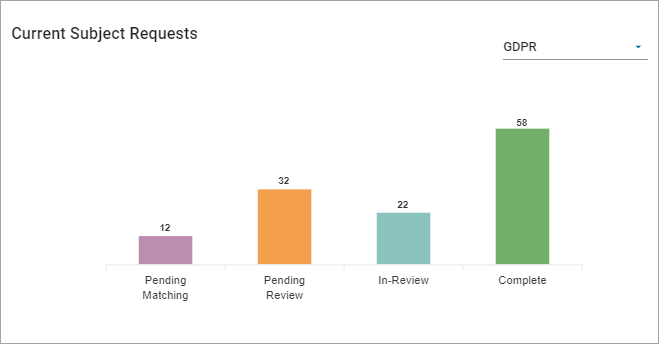
Current Subject Requests:
Displays subject requests are sorted by regulation:
-
Displays totals by status group.
-
Select the drop-down list arrow (
 ) to switch between regulation views.
-
-
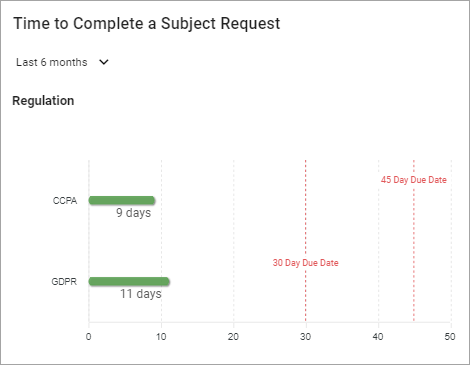
Time to Complete a Subject Request:
Displays requests for a chosen six months previous:
-
Displays totals by regulation and days due.
-
To change the date, click the date line and select a new date.
-
-
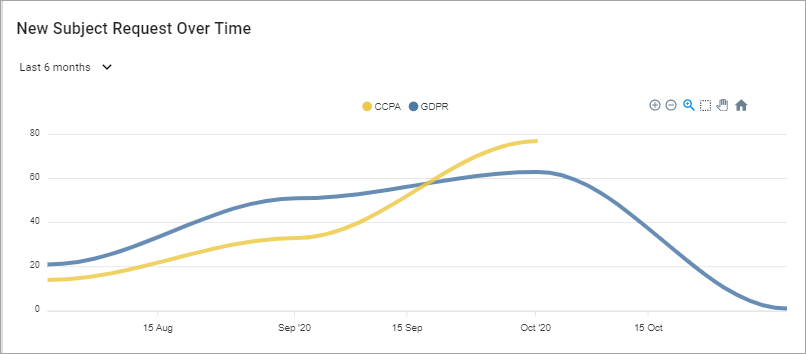
New Subject Request Over Time:
Displays subject requests for a chosen time span:
-
Sorted by regulation
-
To change the date, click the date line and select a new date.
-
-
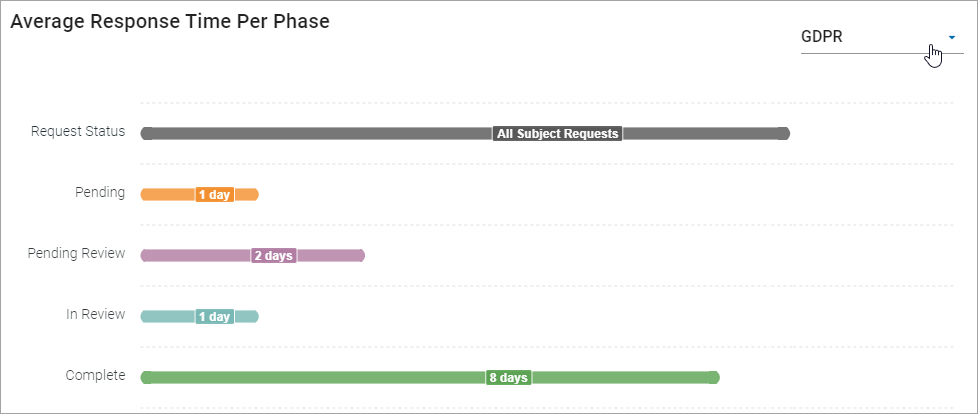
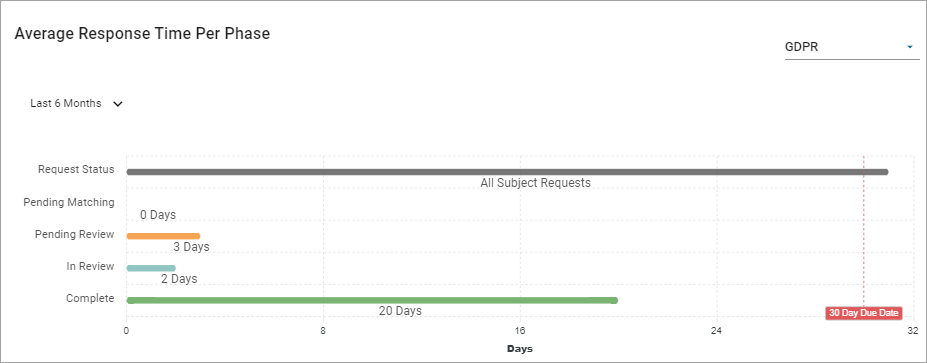
Average Response Time per Phase:
Displays the average response time per phase sorted by regulation:
-
Displays totals by status group.
-
Select the drop-down list arrow (
) to switch between regulation views.
-
-
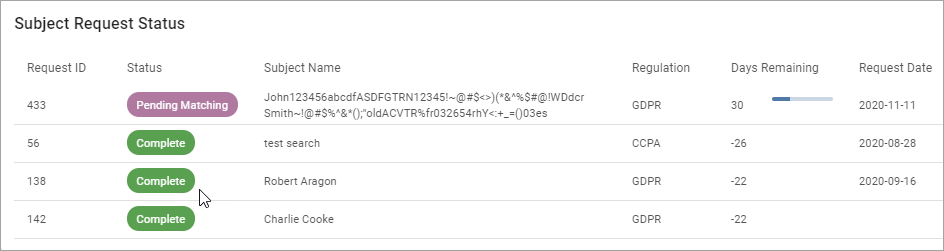
Subject Request Status:
Displays the request status sorted by:
-
Request ID
-
Status
-
Subject Name
-
Regulation
-
Days Remaining
-
Request Date
-
-
Average Response Time per Phase:
-
Displays average response time per phase sorted by regulation over a set time period.
-
-
For more information on Subject Requests, see Working with Subject Requests.